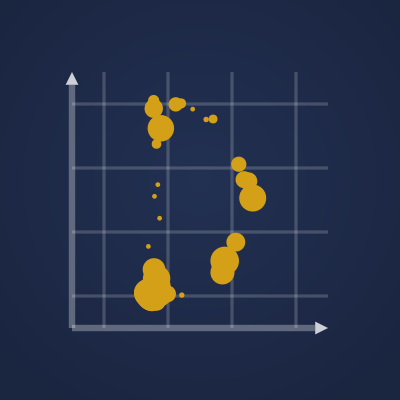
The NFL Draft
Outside the first round, only about 40% of drafted players ever receive substantial guaranteed money on a second contract: the league’s own signal that a pick paid off.
Drafted players, 2018–2021.
Tap a flow, round, or band to trace it.
- Top 5 at position — top-5 guarantees at the position
- Minimum — minimum-level guarantees
- Top 10 at position — top-10 guarantees at the position
- Signed, $0 guaranteed — signed, nothing guaranteed
- Middle class — middle-class guarantees
- Never re-signed — no second contract
What is DraftMap?
DraftMap is a map of the NFL Draft. It lays out, in a single view, what the consensus projected, how teams actually drafted, and what became of every pick. You can take in a full class all at once and explore at your own pace.
Why It Exists
Leading up to the draft, the coverage piles up: rankings, mock drafts, profiles, takes, more rankings. And it starts earlier every year.
Most of us tune out for a while just to clear our heads.
What was missing was something visual. The eye naturally takes in a whole field faster than any list can.
A way to run what-ifs. To see the cliffs where talent drops off. To follow along on draft day. To chase down the question you ask every year: whatever happened to the player your team passed on?
That’s why I built DraftMap.
The Unexpected Challenge
Visually painting the consensus rankings and the actual picks was the easy part.
The hard part was everything after: measuring what each player became on the field against where he was drafted.
There’s no shortage of opinions, and I’m no scout, so most are better than mine. But the honest truth is that even the scouts and front offices are guessing on draft night.
So, underneath it all, one question kept surfacing: is there an objective measure of how a player actually performs on the field after being drafted?
After all, the NFL season ends with a Super Bowl champion. One team left standing above every preseason ranking. Does the draft have an answer like that?
Letting the League Answer
It does. And the answer, surprisingly, comes from the league itself.
Part of it is playing time. A team can only field eleven men at once, so how often a draft pick plays isn’t opinion. It’s a deliberate decision by the coaching staff.
But playing time only gets us halfway. Every team plays its best players, but some teams’ best are better than others.
The full answer arrives when a player’s rookie deal ends and the league’s open market sets the player’s value, in guaranteed money. Real dollars. Real cap space. Front office jobs on the line.
DraftMap measures that value as the full guarantee in a player’s second contract. Not the headline number: the money a team truly commits. It weighs that figure against the top of the player’s own position, and against the salary cap in the year the deal was signed. A guarantee that’s mid-tier money for a quarterback would sit near the top for a running back.
Neither measure is perfect. But together they’re the closest the sport has to an objective measure of a player’s value.
DraftMap normalizes both by position so they’re comparable, and that’s it.
The projections aren’t mine. Act 1 is a consensus ranking from public draft sources. Act 2 is the pick and Act 3 is the second contract, both the league’s own doing.
I’m not asking you to trust my opinion, because I don’t offer one. I just show you what the league decided.
We Weren’t the Only Ones
While reasoning these concepts out on my own for DraftMap, I was stunned to learn that others had reached the same conclusion, only far more rigorously.
Researchers led by Jason Merrick of Virginia Commonwealth University, with Wharton’s Cade Massey among them, had reached the same core insight: that a player’s second contract, what the market pays, is the truest read on draft value. They measure it as a share of the salary cap; DraftMap sorts it against the top of each position. An NFL team had handed them twelve years of its private scouting data to work from. Their study is far more comprehensive than anything I could do, and Massey himself co-wrote “The Loser’s Curse,” the foundational study of how teams overvalue their top draft picks.
“A player’s first contract is based on draft position, so it’s a prediction: how good a team thinks you’ll be. But your second contract is based on your market value to the team, so it’s an outcome.”
For the details, I defer to their Wharton School research paper. It’s exceptional, and well worth your time. (See also the VCU write-up.)
Get in Touch
Have an idea, found a bug, or want to build something together? Reach me at ✉ data@draftmap.app. DraftMap is a labor of love, and I personally read every message.
Open the map →